Key Consolidated Business Indicators
| Term | 101st | 102nd | 103rd | 104th | 105th | |
|---|---|---|---|---|---|---|
| Fiscal year ended | March 2021 | March 2022 | March 2023 | March 2024 | March 2025 | |
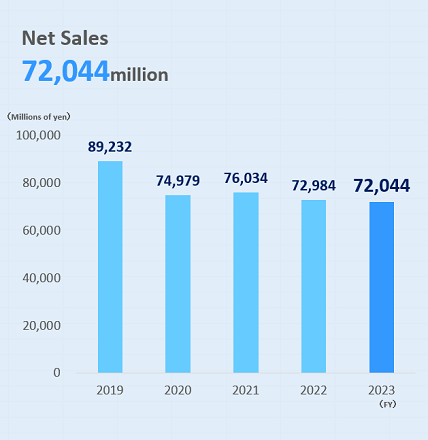
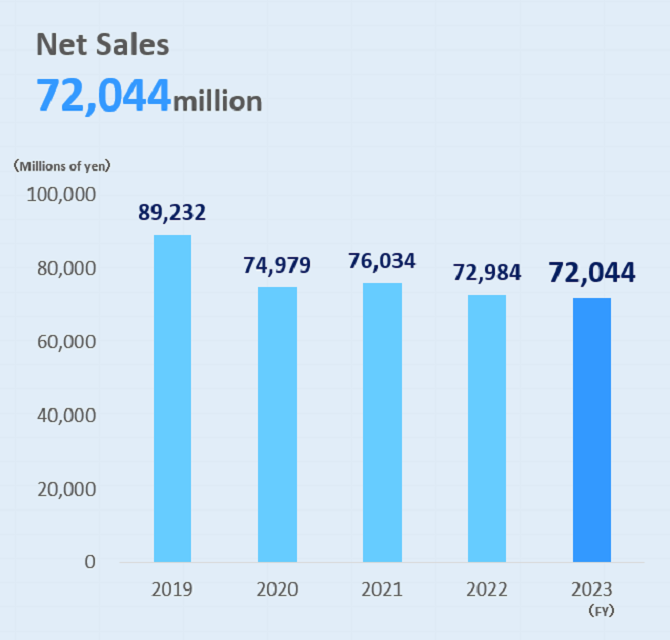
| Net sales (Millions of yen) | 74,979 | 76,034 | 72,984 | 72,044 | 94,035 | |
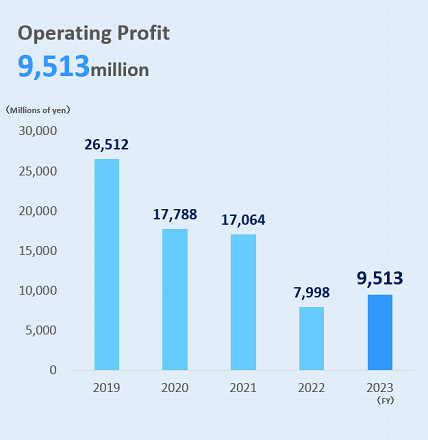
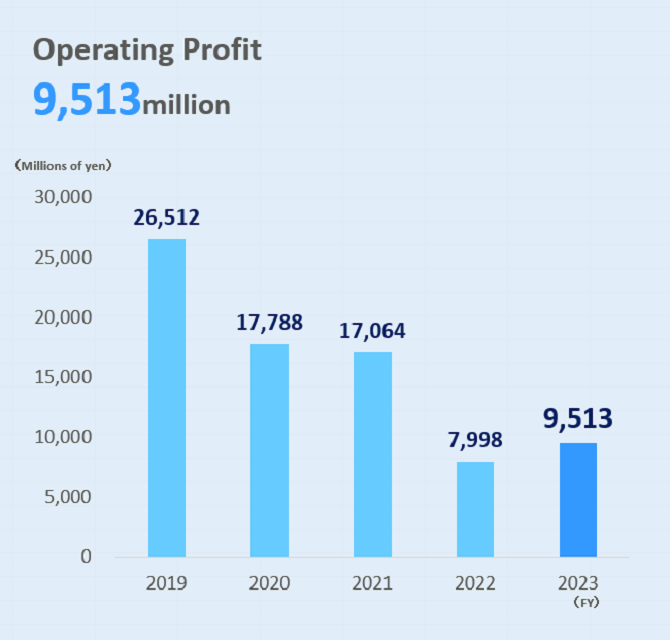
| Operating profit (Millions of yen) | 17,788 | 17,064 | 7,998 | 9,513 | 21,034 | |
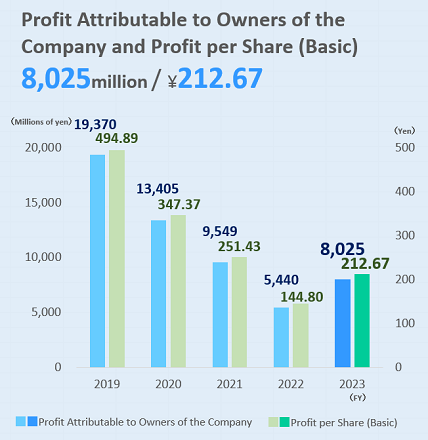
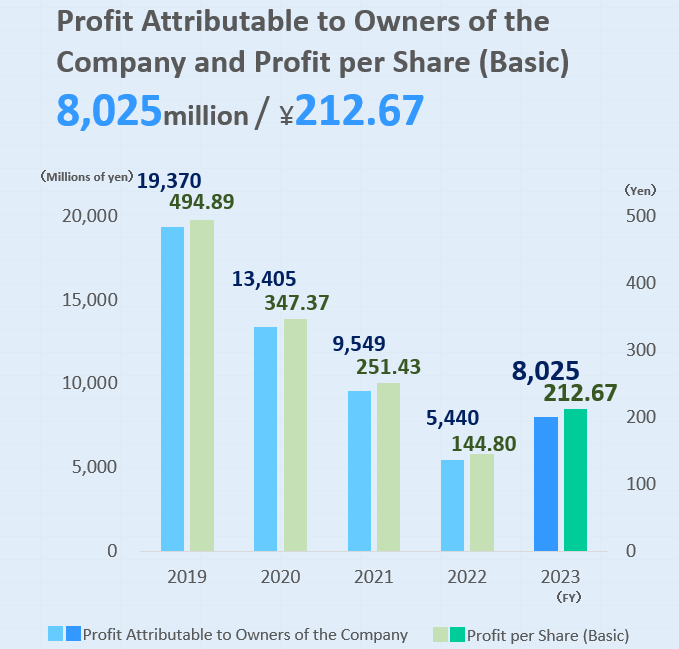
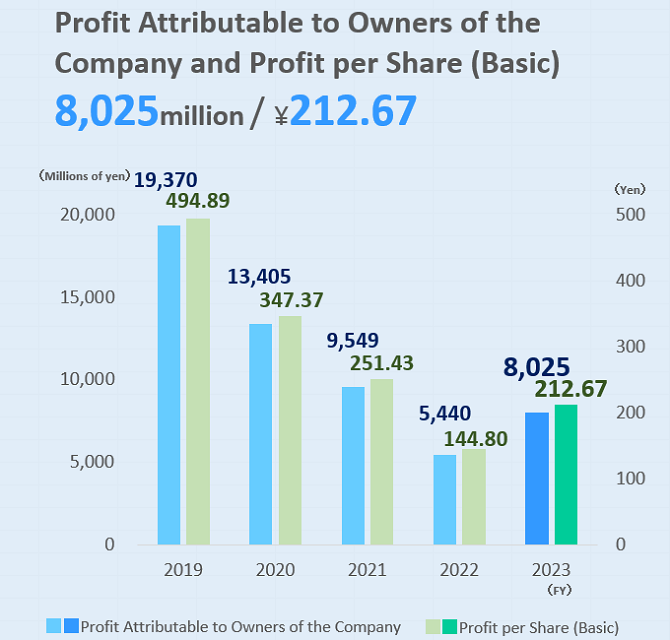
| Profit attributable to owners of the Company (Millions of yen) | 13,405 | 9,549 | 5,440 | 8,025 | 13,945 | |
| Comprehensive income (Millions of yen) | 16,532 | 9,563 | 5,475 | 11,684 | 14,237 | |
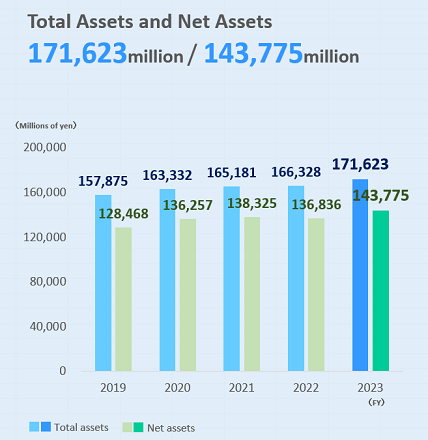
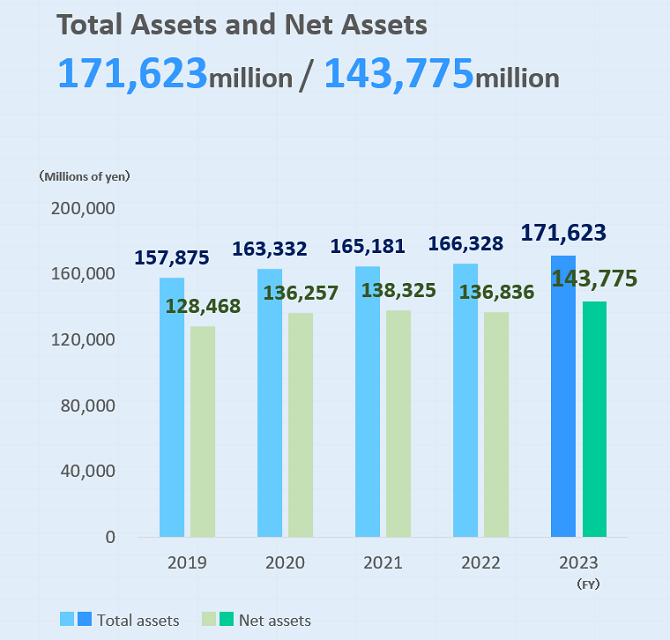
| Net assets (Millions of yen) | 136,257 | 138,325 | 136,836 | 143,755 | 152,634 | |
| Total assets (Millions of yen) | 163,332 | 165,181 | 166,328 | 171,623 | 190,422 | |
| Net assets per share | (Yen) | 3,555.93 | 3,642.34 | 3,636.17 | 3,796.05 | 3,974.47 |
| Profit per share | (Yen) | 347.37 | 251.43 | 144.80 | 212.67 | 365.42 |
| Equity ratio | (%) | 83.4 | 83.4 | 81.9 | 83.8 | 80.2 |
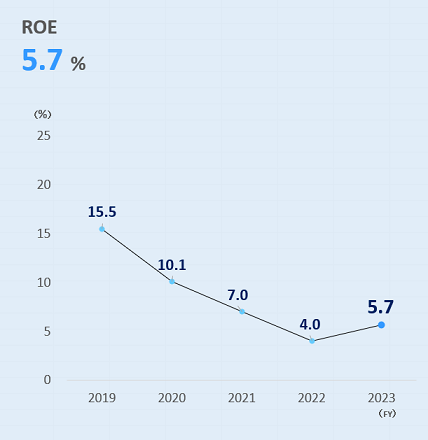
| Return on equity | (%) | 10.1 | 7.0 | 4.0 | 5.7 | 9.4 |
| Price/Earnings ratio | (Times) | 12.5 | 15.5 | 25.5 | 16.3 | 12.3 |
| Cash flow from operating activities (Millions of yen) | 14,380 | 13,336 | 9,253 | 2,577 | 29,780 | |
| Cash flow from investing activities (Millions of yen) | (1,644) | (7,888) | (2,627) | (5,854) | (19,650) | |
| Cash flow from financing activities (Millions of yen) | (8,752) | (8,129) | (6,990) | (5,658) | (5,369) | |
| Cash and cash equivalents at end of year (Millions of yen) | 77,305 | 74,625 | 74,260 | 65,325 | 70,085 | |
Related Data
| Term | 101st | 102nd | 103rd | 104th | 105th |
|---|---|---|---|---|---|
| Fiscal year ended | March 2021 | March 2022 | March 2023 | March 2024 | March 2025 |
| Selling, general and administrative expenses (Millions of yen) | 23,118 | 24,511 | 31,556 | 29,025 | 37,497 |
| R&D expenditures (Millions of yen) | 6,736 | 8,420 | 15,789 | 12,543 | 18,725 |
| Capital investment in new business and capacity expansion (Millions of yen) | 2,136 | 3,510 | 1,968 | 2,304 | 3,418 |
| Depreciation and amortization (Millions of yen) | 2,318 | 2,481 | 2,546 | 2,596 | 2,475 |


